Sunny Days, by Kim Zussman
Currently we have strong earnings, tame inflation, a smug Fed showing signs of a Bernanke-put, high productivity without wage pressure, declining oil and commodity prices, new all-time high on Dow, new six year high on SP500, stock earnings yield higher than bonds, and near record low volatility. Tests of new highs, big advances, and consecutive up-months don't show any signs of trouble ahead.
Could it be that all the bruised and battered hold-outs from '00-'03 will finally join in and we resume the incessant trek toward the summit of market-based capitalism?
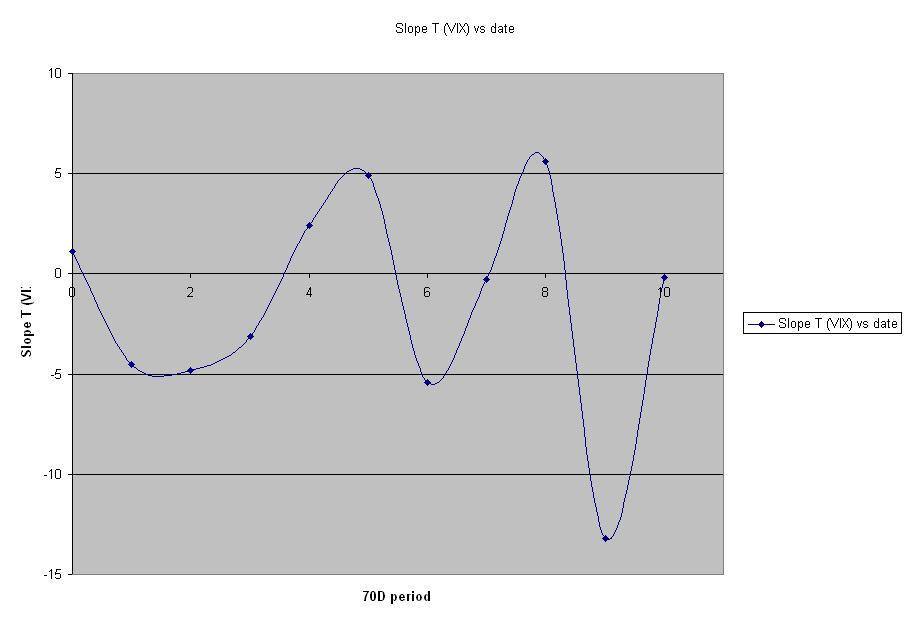
Looking further into VIX, partitioned daily VIX closes into ten non-overlapping 70 day periods, 1/04-present. For each period, the regressed VIX vs. date is shown, and it is noted whether the slope of the fitted line was significant (i.e. T<-2 means VIX declined significantly, T>2 means it went up). Here is the data for the ten periods, shown with corresponding slope T score:
Date VIX slopeT
10 -0.2 (period ending at present)
9 -13.2
8 5.6
7 -0.3
6 -5.4
5 4.9
4 2.4
3 -3.1
2 -4.8
1 -4.5
0 1.1 (starting 1/04)
These line segments follow rise and declines in volatility, as well as "flat" periods like the current one. Last summer's volatility spike shows in period eight, T = 5.6, followed famously by the decline of period nine (T = -13.2). Although there does appear to be some periodicity (see roller-coaster diagram), there are also consecutive runs of up and down slope.