Divergent Tail, from Steve Ellison
Alexander Elder calls a bar that sticks down (or up) by itself on the chart a kangaroo tail. Price goes to a new level, but quickly pulls back. For example, the second to last bar on the attached chart is a kangaroo tail.
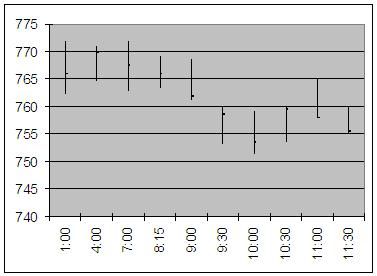
I defined a kangaroo tail as a bar on the 30-minute chart* that had at least 50% of its length either above the high of both adjacent bars or below the low of both adjacent bars. I also required this 50% or greater protrusion to be at least 50% of the average 30-minute range.
I found 18 kangaroo tails in the S&P 500 futures since October 24, 2008, of which 10 stuck down and 8 stuck up. I then calculated the change in the S&P 500 futures from the end of the bar after a kangaroo tail (the earliest point at which a kangaroo tail can be identified) until the same time the next day. Results appeared consistent with randomness:
Close Close
1 bar 24 hrs
Date Time Low Protrusion Direction later later Change
10/24/2008 9:00 835.0 51% down 860.0 868.0 0.9%
11/17/2008 1:00 850.4 50% down 865.6 831.9 -3.9%
11/20/2008 9:30 774.5 58% down 801.5 747.0 -6.8%
12/31/2008 15:20 890.5 75% down 904.8 920.8 1.8%
1/15/2009 15:00 829.5 60% down 839.3 848.6 1.1%
1/27/2009 7:00 832.6 62% down 840.0 859.3 2.3%
1/30/2009 13:00 823.0 54% down 830.5 815.2 -1.8%
2/11/2009 15:00 826.3 56% down 831.5 835.4 0.5%
2/16/2009 1:00 810.1 70% down 816.5 789.8 -3.3%
2/18/2009 9:30 778.2 50% down 784.0 787.7 0.5%
Average -0.9% Standard deviation 3.0%
N 10
t -0.69
Average of all 24-hour periods -0.2%
Close Close
1 bar 24 hrs
Date Time High Protrusion Direction later later Change
10/24/2008 12:30 882.0 51% up 860.0 885.0 2.9%
10/27/2008 9:30 881.5 52% up 871.5 846.5 -2.9%
10/27/2008 10:30 881.0 53% up 869.0 857.5 -1.3%
11/20/2008 12:00 820.0 72% up 797.0 753.5 -5.5%
1/9/2009 8:15 915.8 50% up 890.5 880.5 -1.1%
2/2/2009 15:00 827.5 89% up 821.3 831.5 1.2%
2/5/2009 11:30 847.5 58% up 843.5 860.8 2.1%
2/25/2009 11:00 765.0 69% up 755.5 765.5 1.3%
Average -0.4% Standard deviation 2.8%
N 8
t -0.17
Average of all 24-hour periods -0.2%
* My "30-minute" charts use longer time periods per bar during the overnight session