Payoff to Avoiding Both Up and Down Volatility, from Kim Zussman
(Caveat: easier said than done)
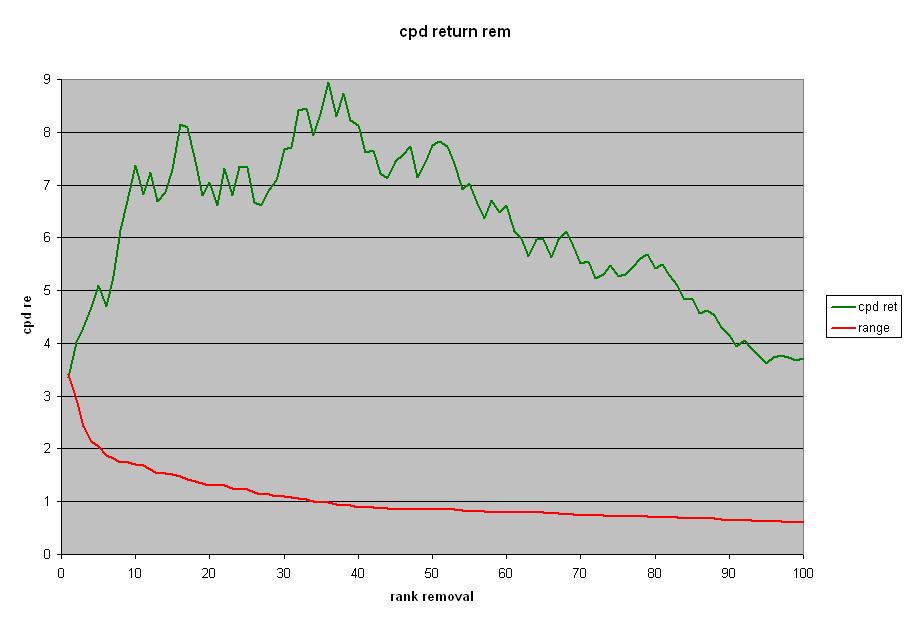
SPY monthly returns (1993-present, with div) were checked for a normalized proxy of intra-month range = (H-L)/C. The series was then ranked by range, along with corresponding monthly returns. These monthly returns were multiplied for the entire 17 year period, which gives a total return of 3.35 ($100 became $335). This was then repeated after successively skipping first the highest range month, then second, all the way to skipping the highest 100 range months. This allowed evaluation of the effect of being "out of market" on final compounded return - whether or not the high range months were up or down.
The graph below shows the effect. Cpd return is the green line, which rapidly increases by skipping (and investing in "cash" = multiplicative return of 1.00) the highest range several months, and continues to outperform B/H up to 100 months skipped. Range of skipped months is plotted in red; for scale on this graph multiplied X10 (eg, range of 0.34 shows as 3.4).
Here are the compound returns, successively skipping the top 20 range months, with dates:
Date ret H-L/C CPD
10/01/08 0.83 0.34 3.35
11/03/08 0.93 0.29 4.01
07/01/02 0.92 0.24 4.31
09/04/01 0.92 0.21 4.68
03/02/09 1.08 0.20 5.10
02/02/09 0.89 0.19 4.70
08/03/98 0.86 0.18 5.27
09/02/08 0.91 0.17 6.14
01/02/09 0.92 0.17 6.77
10/01/98 1.08 0.17 7.38
03/01/01 0.94 0.17 6.83
10/01/02 1.08 0.16 7.23
10/01/97 0.98 0.15 6.68
01/02/08 0.94 0.15 6.85
09/03/02 0.90 0.15 7.29
08/01/02 1.01 0.15 8.14
04/02/01 1.09 0.14 8.09
03/01/00 1.10 0.14 7.45
04/03/00 0.96 0.14 6.79
In fitting with decline = volatility, only 6/20 biggest range months were up.
Steve Ellison writes:
Using Dr. Zussman's results as a starting point, since I am not very good at determining the monthly range before the month begins, I checked what would happen if one skipped the month after a month with a high range. SPY total return including dividends from the end of 1993 to the end of 2009 was 3.14, for an average monthly return of 1.0060. If one held cash in all months following a month in the top 10% of ranges to date, and held SPY in all other months, total return would have been 1.98, with 140 months in the market and 52 months out. Average monthly return would have been 1.0049.
Since the end of August 2007, however, the average monthly return following a month with a range in the top 10% of historical values has been 0.9707, while the average monthly return of other months has been 0.9992. Thus, substantially all the losses of the last two years occurred in months following months of very high ranges.
Example:
90th
pctile
Month ending H-L/C H-L/C Position Return
9/30/2008 0.18 0.13 in 0.9058
10/31/2008 0.35 0.13 out 0.8349
11/28/2008 0.30 0.14 out 0.9303
12/31/2008 0.12 0.14 out 1.0098
1/30/2009 0.18 0.14 in 0.9179
2/27/2009 0.19 0.14 out 0.8925
3/31/2009 0.21 0.14 out 1.0833
4/30/2009 0.12 0.14 out 1.0993
5/29/2009 0.08 0.13 in 1.0585
6/30/2009 0.08 0.13 in 0.9993
7/31/2009 0.13 0.14 in 1.0746
8/31/2009 0.06 0.14 in 1.0370
9/30/2009 0.08 0.15 in 1.0354
10/30/2009 0.08 0.14 in 0.9809
11/30/2009 0.08 0.15 in 1.0615
12/31/2009 0.04 0.16 in 1.0191
Rocky Humbert asks:
Is this study and its results more than a reflection that (historically) a higher VIX → lower return?
Bill Rafter comments:
VIX is simply one form of volatility. It is logical to assume that some of the other forms may lead VIX, and that those may be causative and have predictive value. If they have predictive value for VIX and VIX is coincidental with declining equities, then you have something on which to build.
Dr. Rafter is President of Mathematical Investment Decisions, a quantitative research consultancy