Log Nasdaq vs Log SP500, from Kim Zussman
The attached chart is plot of weekly closes of the Nasdaq vs corresponding (by date) log SP500; the time period is 1971 to Present.
Mostly a linear relationship (not mathematically one-to-one as there can be various log nas for a given log sp500), but note the upwardly-divergent squiggle at top right. This is the tech bubble; the overall market was doing "well" but Nasdaq was doing "great". Multiple paths in this area are various relationships with log Nasdaq during the frequent sojourns of log SP500 between 2.8-3.2, ca 1996-present.
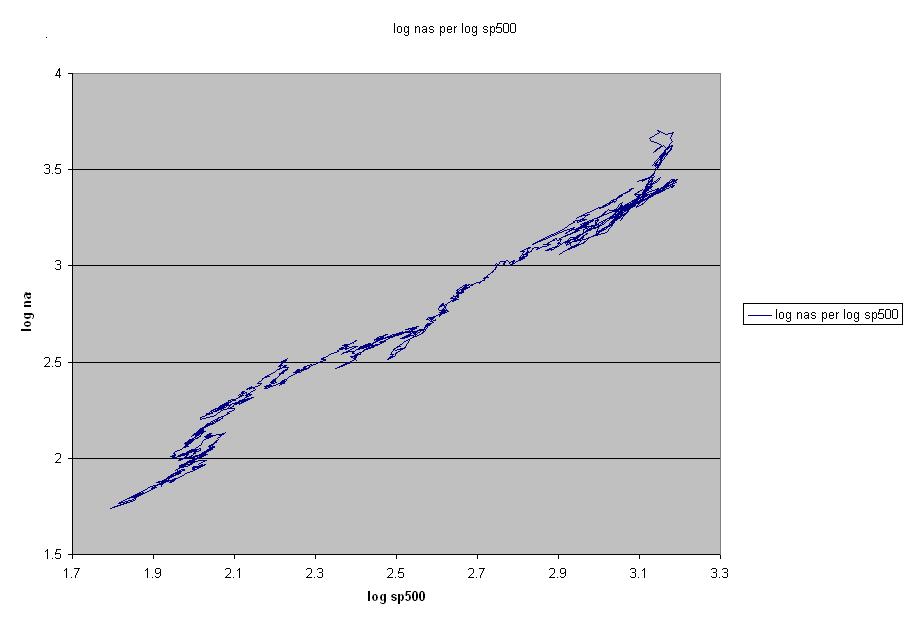
The current point has approximate coordinates (3.0,3.3), in the upper right quadrant. Imagine an arrow "you are here".