Vol to Vol Part 10, from Kim Zussman
Last week SPY dropped 5.2%. Going back to 1993, ranked weekly drops by % as follows:
1: 1-2%
2: 2-3%
3: 3-4%
4: 4-5%
5: 5-6% (like last week)
6: 6-7%
7: 7-or more % (7,7,7,8,8,10,10,19)
Then checked following week's return.
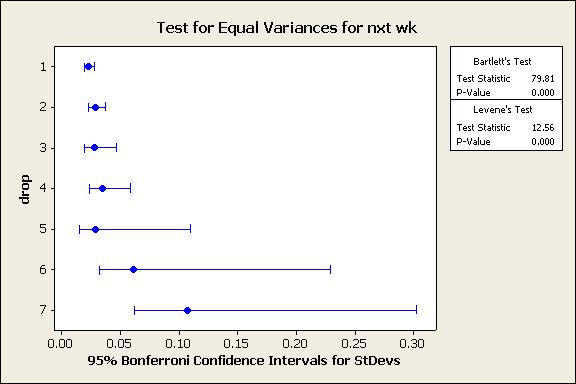
The chart compares variance of next week by prior week's 1-7 ranking; another version of "the wilder it gets the wilder it gets"
Using the same ranking system, this chart compares mean returns of weeks after down weeks ranked 1-7 to the mean returns after weeks declining between 1-19%.
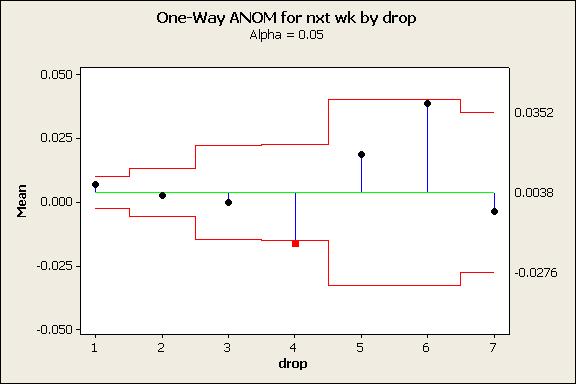
The mean return is positive (NS, see below), but without a monotonic relationship with size of prior week's decline.
One-Sample T: nxt wk
Test of mu = 0 vs not = 0
Variable N Mean StDev SE Mean 95% CI T P
nxt wk 242 0.0038 0.0340 0.00219 (-0.00051, 0.00811) 1.73 0.084