Flashing, from Kim Zussman
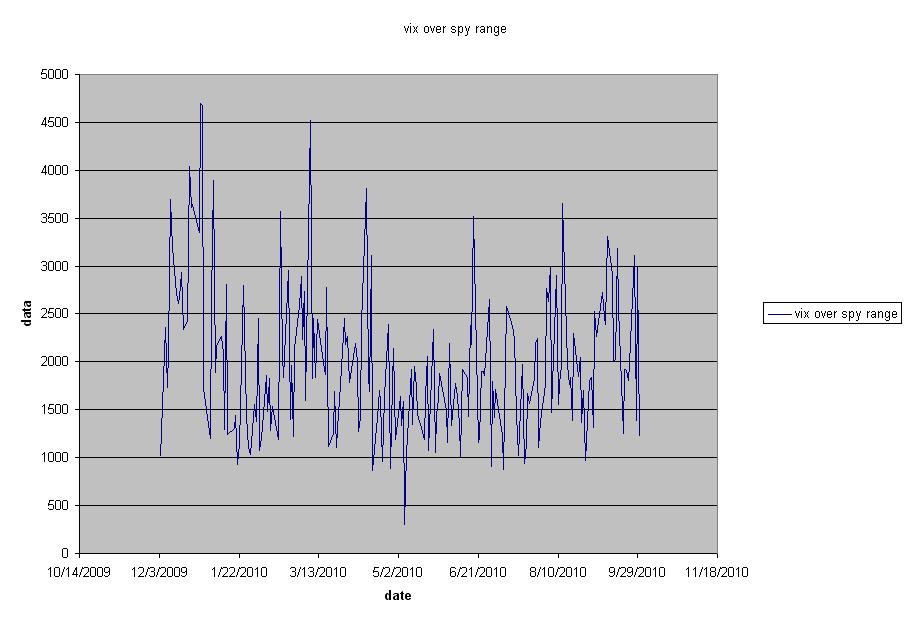
The attached plots the ratio of VIX (daily close) to SPY daily range, defined as (H-L)/{(H+L)/2}.
There is an obvious down-spike which occurred on 5/6/10 - now known as flash crash day.
Deleting that day and comparing VIX/SPYRANGE for the 102 days prior and before flashcrash:
Two-sample T for vix/range vs vix/range pre
SE
N Mean StDev Mean
vix/range 102 1867 615 61 T=-2.03
vix/range pre 102 2081 870 86
VIX/SPYRANGE is significantly lower since flashcrash. Interestingly both VIX and SPYRANGE are lower since flashcrash:
Two-sample T for vix vs vix pre
N Mean StDev SE Mean
vix 102 26.95 4.93 0.49 T=12.57
vix pre 102 19.83 2.91 0.29
Two-sample T for SPY rge vs SPY rge pre
N Mean StDev SE Mean
SPY rge 102 0.01639 0.00715 0.00071 T=5.9
SPY rge pre 102 0.01126 0.00512 0.00051