Strait shootin’ FED, from Kim Zussman
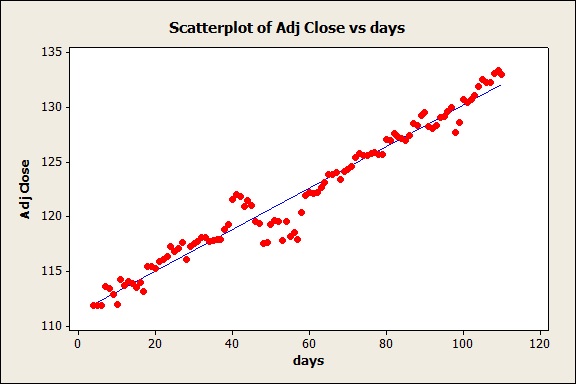
The day-to-day progression of the SP500 has been nearly a perfect straight line for the 5 months since Sept 15, as seen when regressing SPY daily closes vs day number in the series [i.e. regression with a linear trend]:
Regression Analysis: Adj Close versus days
The regression equation is Adj Close = 111 + 0.190 days
The regression equation is
Adj Close = 111 + 0.190 days
Predictor Coef SE Coef T P
Constant 111.231 0.249 446.69 0.000
days 0.19006 0.003841 49.48 0.000
S = 1.22719 R-Sq = 95.9% R-Sq(adj) = 95.8%
The slope of 0.19 shows the precise angle of the non-ballistic trajectory; about 2 SPX points/day. Set your sights accordingly.