Silver and Gold, from Kim Zussman
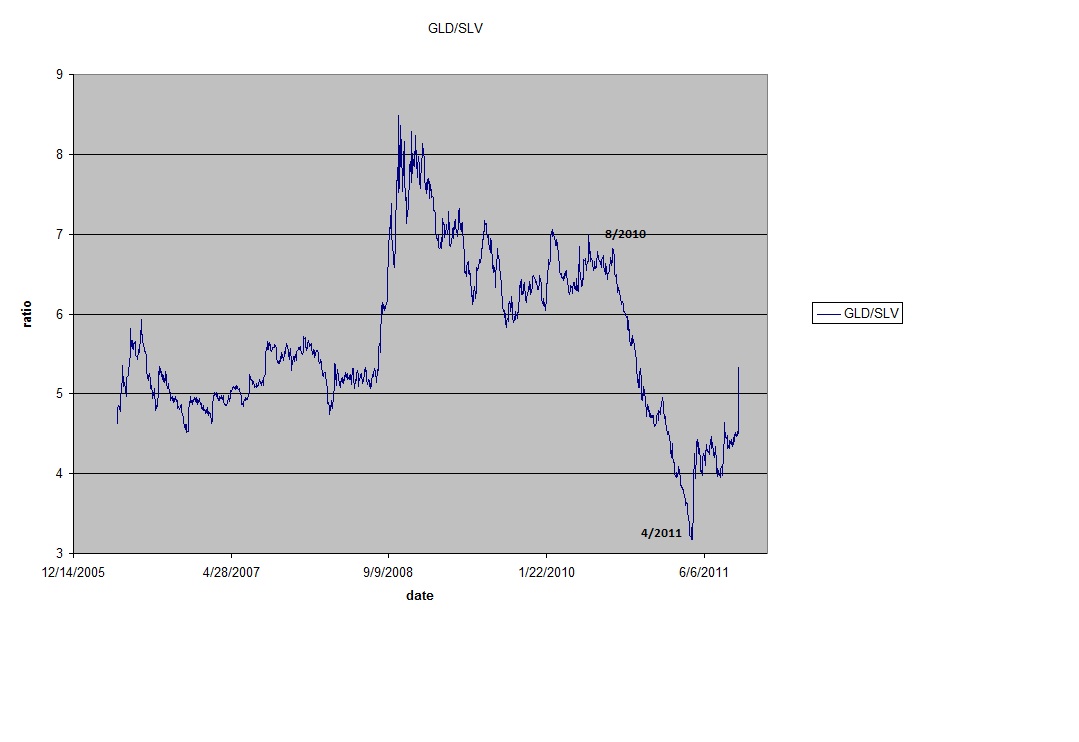
This is a chart of ratio GLD/SLV (gold and silver ETFs, daily, from SLV inception 2006 to last Friday).
The big move down (=relative SLV up) began with the inception of QE2 in Aug 2010, and stopped around the recent top in stocks April 2011.
Just for fun: listen to "Silver and Gold" on youtube.