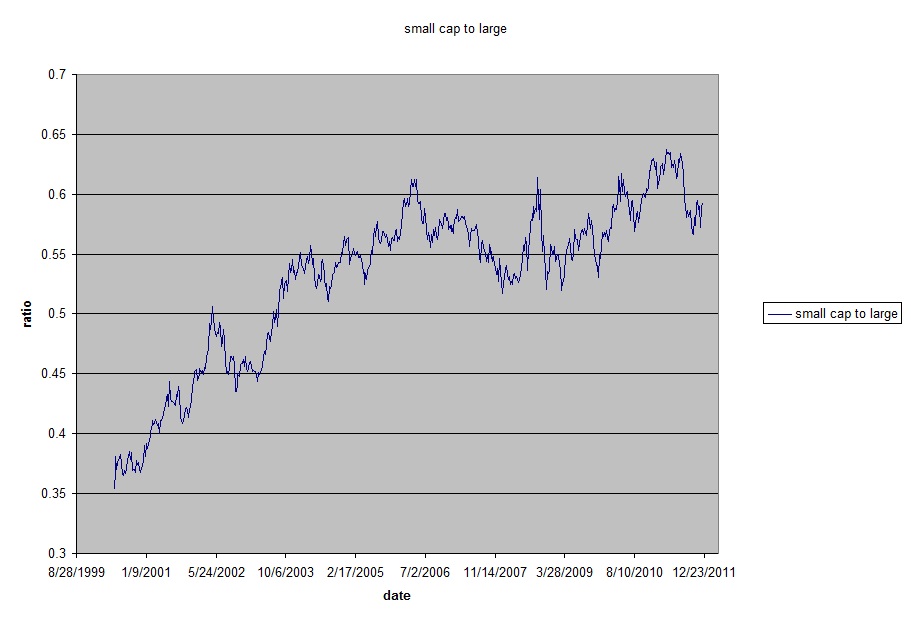
No Lost Decade for S&P EW, from Kim Zussman
Small cap stock out-performance explains at some or all of the equal-weighted SP500 out performing the cap-weighted version. The attached is the ratio of two tradeable ETF's: IWM (Russell 2000 stocks) and SPY (SP500 cap weighted), from May 2000 to present.
On a weekly-return basis, though IWM was was more than 2X higher than SPY they were not significantly different:
Two-Sample T-Test and CI: IWM week, SPY week
Two-sample T for IWM week vs SPY week
N Mean StDev SE Mean
IWM week 601 0.0016 0.0341 0.0014 T=0.6
SPY week 601 0.0006 0.0271 0.0011
Though as expected IWM did have significantly higher volatility:
Test for Equal Variances: IWM week, SPY week
95% Bonferroni confidence intervals for standard deviations
N Lower StDev Upper
IWM week 601 0.0320 0.0341 0.0364
SPY week 601 0.0254 0.0271 0.0289
F-Test (normal distribution)
Test statistic = 1.58, p-value = 0.000
Levene's Test (any continuous distribution)
Test statistic = 24.34, p-value = 0.000