Flexion Index, from Steve Ellison
I defined a Flexion Index as the z score of the price of XLF relative to its 39-week average and standard deviation (for example, a z score of -2 would mean the price was on the lower Bollinger Band). My theory is that flexions are happy when the index is above zero because their stocks are going up and they are getting bonuses. When the index is below -1, the flexions are in distress and likely to clamor for bailouts and accomodative monetary policy.
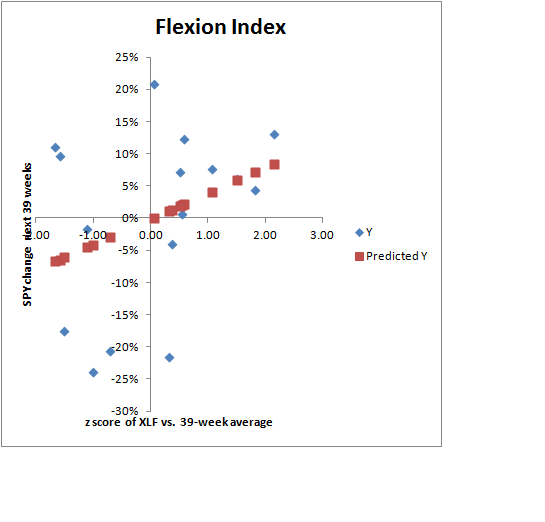
Regressing the net change in SPY in the next 39 weeks against the z score of XLF, I found a positive correlation with N=16 and t=1.40 (scatter plot below). Too few observations for significance; furthermore, 30 weeks into a 39-week period that started with a z score of -2.37 last September, SPY so far has nearly a 20% gain.
39-week Change in SPY
Date XLF average z score next 39 weeks
9/17/1999 22.91 24.84 -1.58 9.6%
6/16/2000 24.00 23.45 0.33 -21.5%
3/16/2001 25.95 27.58 -1.11 -1.6%
12/14/2001 25.50 26.64 -0.70 -20.7%
9/13/2002 22.37 25.35 -1.66 11.0%
6/13/2003 25.34 22.38 2.16 13.1%
3/12/2004 29.57 27.03 1.51 6.0%
12/10/2004 30.04 28.66 1.83 4.4%
9/9/2005 29.87 29.45 0.54 0.6%
6/9/2006 32.69 31.92 0.58 12.3%
3/9/2007 35.87 34.92 0.52 7.2%
12/7/2007 31.20 34.79 -1.50 -17.6%
9/5/2008 21.74 24.72 -1.00 -24.0%
6/5/2009 12.32 12.12 0.05 20.8%
3/5/2010 15.22 14.04 1.07 7.6%
12/3/2010 15.18 14.90 0.37 -4.1%
9/2/2011 12.54 15.55 -2.37