Gold Mining Stocks vs. Gold, from Steve Ellison
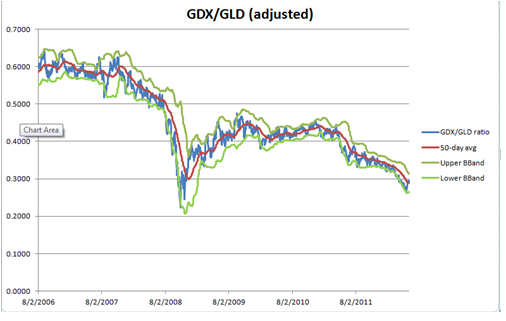
A friend told me recently that gold mining stocks had been declining much more sharply than the price of gold. He therefore thought the stocks were undervalued.
Attached is a graph of the ratio of GDX (the gold mining ETF) to GLD (the physical gold ETF) with a 50-day moving average and Bollinger bands.
Here are the changes in the ratio in the next 50 days after the ratio of GDX to GLD fell below the lower Bollinger band. There have been only 15 non-overlapping occurrences since both ETFs began trading.
Next 50 days
GDX GLD GDX/GLD Ratio GDX GLD
Date Adj Close Adj Clos Ratio change change change
1/18/2007 35.92 62.26 0.5769 1.4% 7.0% 5.6%
8/15/2007 35.42 66.13 0.5356 13.2% 30.2% 15.0%
11/19/2007 44.16 77.24 0.5717 -4.9% 10.0% 15.7%
2/6/2008 46.34 88.95 0.5210 3.2% 5.1% 1.9%
4/24/2008 43.78 87.22 0.5019 -0.2% 4.4% 4.6%
7/24/2008 43.48 91.33 0.4761 -27.0% -34.0% -9.6%
10/3/2008 28.70 82.59 0.3475 4.4% 4.5% 0.0%
3/2/2009 30.72 90.93 0.3378 25.6% 25.3% -0.3%
1/21/2010 43.33 107.37 0.4036 3.8% 7.2% 3.3%
10/19/2010 54.01 130.11 0.4151 6.7% 12.4% 5.3%
1/6/2011 56.58 133.83 0.4228 -1.7% 2.2% 4.0%
5/2/2011 59.95 150.41 0.3986 -3.8% -1.4% 2.5%
8/5/2011 55.26 161.75 0.3416 1.6% 2.1% 0.5%
12/19/2011 51.02 154.87 0.3294 0.0% 7.4% 7.4%
3/14/2012 50.12 159.57 0.3141 -6.2% -11.0% -5.1%
Avg 1.1% 4.8% 3.4%
Std. dev 11.1% 14.6% 6.5%
N 15 15 15
t 0.38 1.05 0.24