Who’s Your Daddy, from Kim Zussman
Monthly 30Y fixed mortgage rates are published by Freddie Mac, 1971-present: http://www.freddiemac.com/pmms/pmms30.htm
This data was used to calculate mean 30Y mortgage rates by year, 1971-2011. Prof Shiller's quarterly real US house price data was also used to calculate mean yearly real house price, 1971-2011.
These data were then analyzed with regression; first regressing this year's change in real house price vs this year's change in 30Y mortgage rate:
The regression equation is
chg HP = 0.00393 + 0.0108 chg 30Y
Predictor Coef SE Coef T P
Constant 0.00393 0.009442 0.42 0.679
chg 30Y 0.01080 0.09513 0.11 0.910
S = 0.0595077 R-Sq = 0.0% R-Sq(adj) = 0.0%
There was no correlation between this year's change in real house price vs this year's change in 30Y mortgage rate.
Is there a correlation with a lagged regression? This year's change in real house price was regressed against last year's change in 30Y mortgage rate:
Regression Analysis: chg HP L1 versus chg 30Y L1
The regression equation is
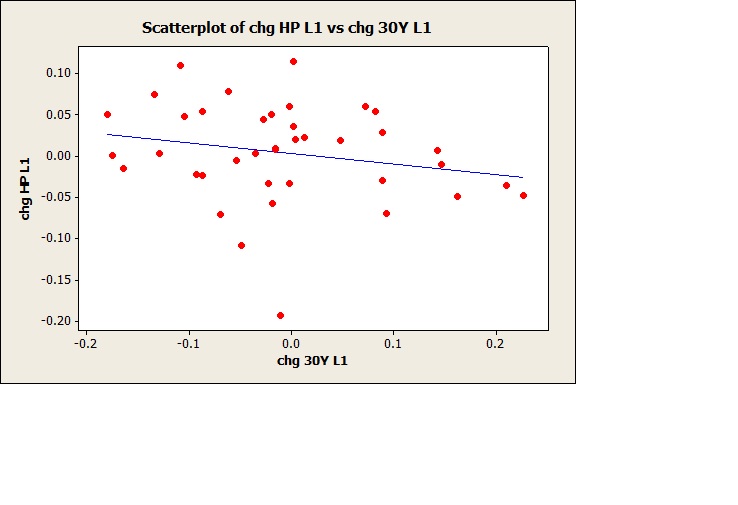
chg HP L1 = 0.00281 - 0.127 chg 30Y L1
Predictor Coef SE Coef T P
Constant 0.00281 0.00945 0.30 0.768
chg 30Y L1 -0.12724 0.09436 -1.35 0.186
S = 0.0588827 R-Sq = 4.7% R-Sq(adj) = 2.1%
Not significant, but as one might expect if last year's mortgage rates dropped, this year's house prices increased slightly (see scatter plot).
Evidently there is a weak effect of mortgage rates on real house prices
Just for fun:
The Zombies- Time of the Season [video]
The Zombies- She's Not There[video]