Do People Vote Their Pocket-Book or Clan? from Kim Zussman
2012 presidential election voting data by state was obtained from this source.
States were analyzed according to income ratio of top 5% to bottom 20% using this data.
Regressing the ratio (top 5%/bottom fifth) vs. fraction voting for Obama did not uncover a significant correlation:
Regression Analysis: 5%/bot fifth versus Obama
The regression equation is
5%/bot fifth = 10.5 + 3.11 Obama
Predictor Coef SE Coef T P
Constant 10.496 1.507 6.97 0.000
Obama 3.111 2.992 1.04 0.304
S = 2.50077 R-Sq = 2.2% R-Sq(adj) = 0.2%
Based on this one cannot conclude that Obama's election results were correlated with income inequality. (NS also regressing vs % voting for Romney) How does this compare to state's racial demographics?
State racial demographic data was obtained from the 2000 census; extracting the ratio of those identifying as "non-hispanic/latino white" to total population (% white).
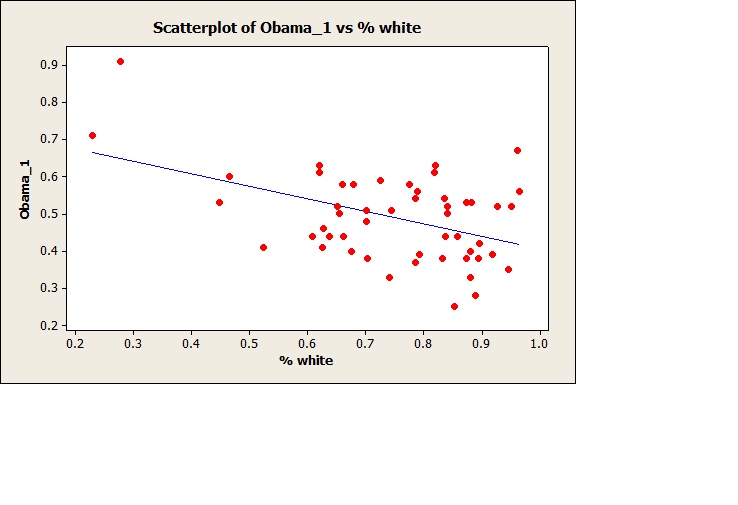
Using this data, regressed fraction voting for Obama vs % white by state:
Regression Analysis: Obama_1 versus % white
The regression equation is
Obama_1 = 0.740 - 0.334 % white
Predictor Coef SE Coef T P
Constant 0.73967 0.07075 10.45 0.000
% white -0.33382 0.09241 -3.61 0.001
S = 0.106100 R-Sq = 21.0% R-Sq(adj) = 19.4%
In terms of state populations, there was a significant negative correlation between % voting for Obama and % white. A similar opposite) positive correlation was found for % voting for Romney (not shown).