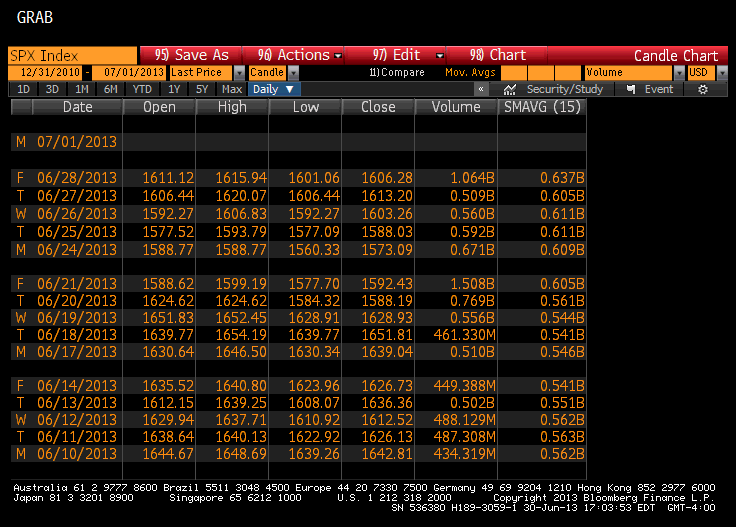
A Question to be Investigated, from Victor Niederhoffer
Are there any tendencies for S&P levels classified by 10 point intervals like
1590 - 1599 = 9
1600 - 1610 = 0
1610 - 1620 = 1
1680 - 1690 = 8
to be springing or compressing in the subsequent day, i.e. is it bullish or bearish when the S&P index closes at 1607 the way it did on Friday, perhaps classified by the path preceding day?