The Stock-Bond Dance, from Kim Zussman
The attached chart plots weekly closes of DJIA (DIA ETF) per the corresponding long-bond price close for that week (TLT).
The irregular line follows the relationship over time, from 7/02-present.
As the line moves from lower left to upper right, stocks and bonds are both rising (higher slope means rate of increase stocks>bonds, and vice versa).
From 7/02-10/07, stocks rose faster than bonds but both increased.
From 10/07-3/09, stocks declined while bonds increased.
From 3/09-7/12, stocks and bonds increased - with greater variation than the 7/02-10/07 period.
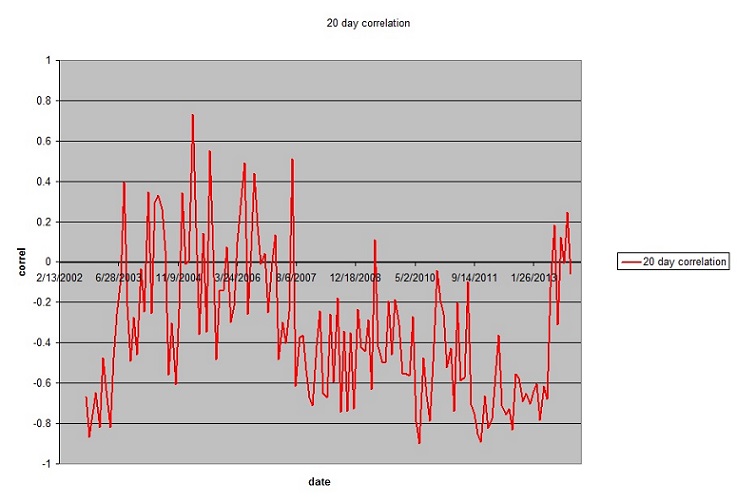
From 7/12-present, bonds have generally declined while stocks continued to increase.
The recent move went from upper-right to lower-left (bonds and stocks both declined), a pattern that appears rarely in the chart.
Benian motion instead of Brownian?