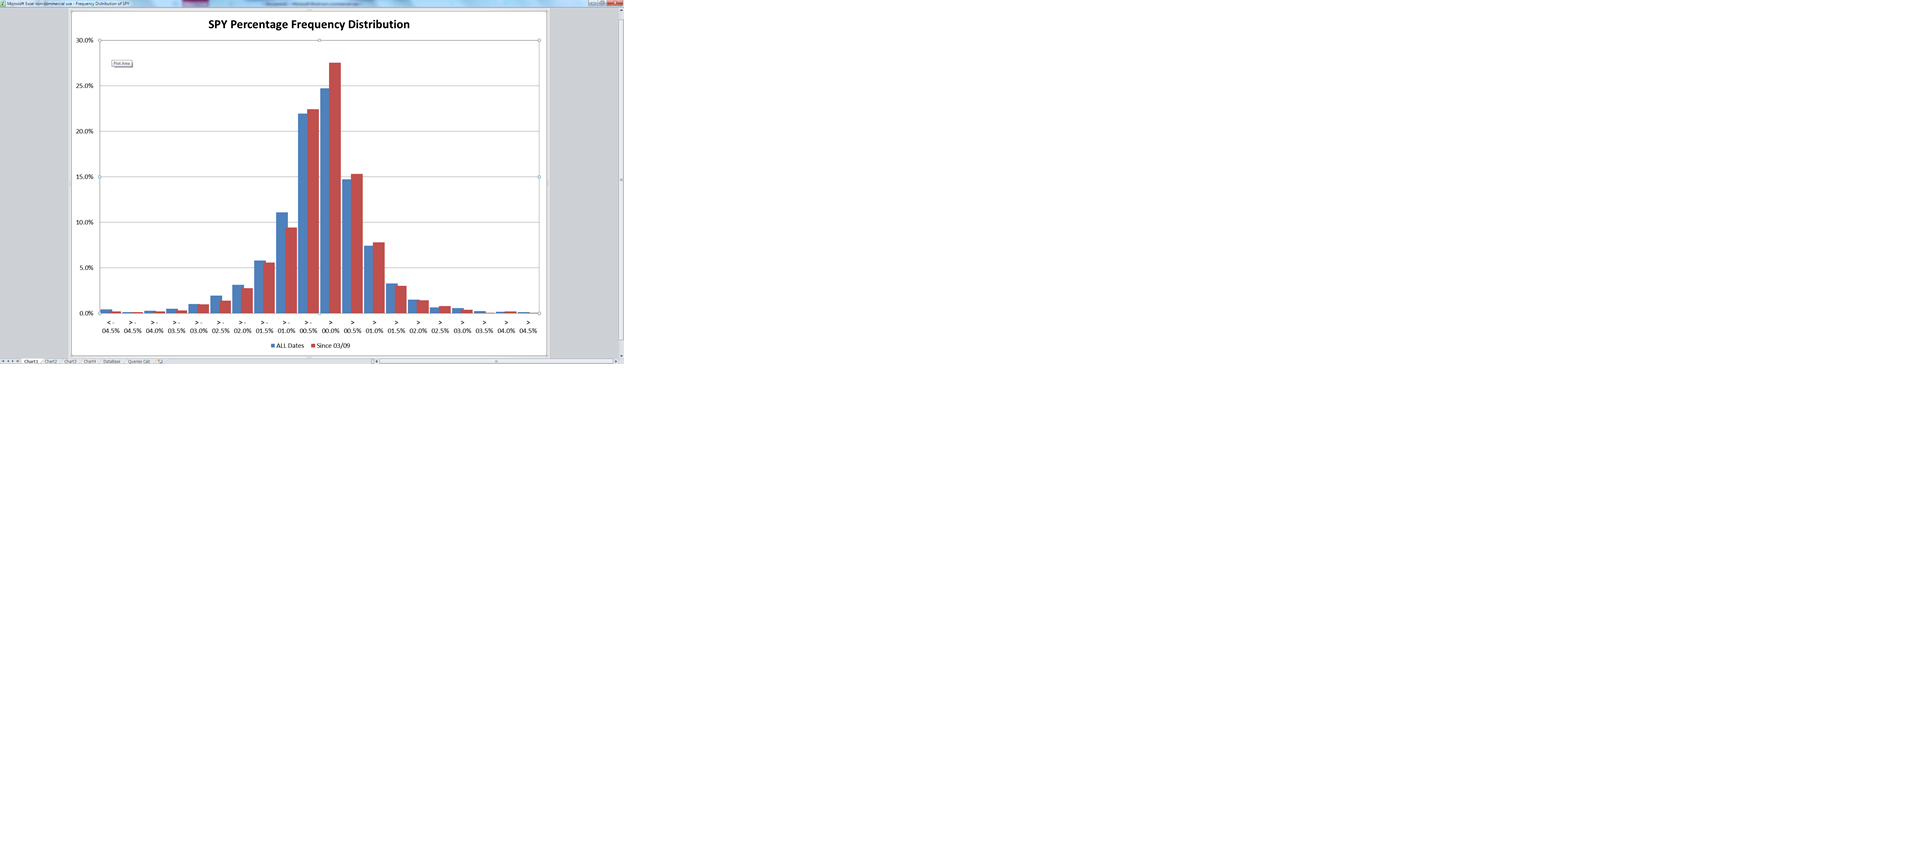
SPY Frequency Distribution, from Russ Sears
I did some graphs of SPY Frequency Distribution in 5 different regimes (1993-1999) (2000-2001)(2007-3/2008) (3/08- current) (1/1/2015 - current).
The noticeable difference between Bulls and Bears regimes is twofold:
*First,
Bulls: higher percentage of days that are boring > -0.5% and < + 0.5%
Bears: lower than normal.
*Second finding,
Bulls: fewer terrible days < -0.5%
Bears: more
*But,
About the same percentage of great days > +0.5% in Bulls or Bears case
This used lognormal returns.
Graph 1 3/2009 to now