Yearly All Time Highs, from Kim Zussman
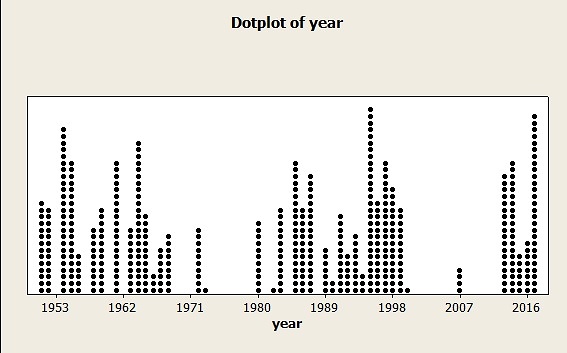
I checked SP500 weekly closes for new all time highs per year, back to 1951. 2017 was second highest total weekly ATHs in the series (also see attached plot):
year Count
1951 14
1952 13
1954 25
1955 20
1956 6
1958 10
1959 13
1961 20
1963 10
1964 23
1965 12
1966 3
1967 7
1968 9
1972 10
1973 1
1980 11
1982 1
1983 13
1985 20
1986 13
1987 18
1989 7
1990 2
1991 12
1992 6
1993 9
1994 3
1995 28
1996 14
1997 20
1998 16
1999 13
2000 1
2007 4
2013 18
2014 20
2015 6
2016 8
2017 27
And the outlook? Sorting years with at least 20 new weekly ATHs, here is comparison of mean returns for years following these years - along with mean returns for all years:
One-Sample T: nxt yr, all yr
Test of mu = 0 vs not = 0
Variable N Mean StDev SE Mean 95% CI T P
nxt yr 7 0.111 0.137 0.051 (-0.015, 0.237) 2.14 0.076
all yr 65 0.085 0.162 0.020 ( 0.045, 0.125) 4.24 0.000
so the return is +11% vs +8.5% for all years. No bearishness here.
Comments
Andre on January 4, 2018 1:06 pm
I’m wondering how studies with a year timeframe can be used practically in a speculation or trading system. Always in long can’t use it and in a trading system there’s too few observations in your lifetime to justify it. After all there’s sizable chance that the market bucks the statistics and then you’re out a year and are you now waiting for the next year? Year studies are used by arm chair market participants who are always in long and are just justifying their always in long.