The Great Sam Eisenstadt, from Victor Niederhoffer
 The great Sam Eisenstadt ran a predictive regression with the future S&P changes highly correlated with the direction and magnitude of the preceding 12 months cumulatively. Right now he'd be forecasting another 10% rise or so for the next 3 months. I did something like this last year where I looked at the performance of the last 3 months based on the previous 9 months. As I recall it was very indicative of a good Oct to Dec when the first 9 months were up substantially… could someone update that study? I don't have the resources and haven't unpacked my books from my move from NY to Conn yet so I can't look at the S&P Security Price Record.
Steve Ellison replies:
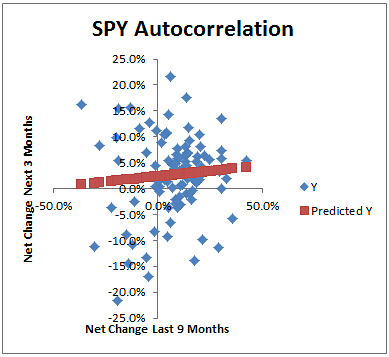
Using SPY (adjusted for dividends) data since 1993, I find a
positive slope for the regression of the previous 9 month's net change
with the next 3 months' net change with a t score of 0.79 and p=0.43.
The scatter diagram is attached. Here is the data I used.
Date        Adj Close  9-month change   next 3-month change
 12/31/1993  29.473475           5.2%             -3.7%
  3/31/1994  28.371059           0.8%              0.4%
[.....]
12/29/2017 263.41486          14.9%             -1.0%
  3/29/2018 260.79306          10.4%              3.6%
  6/29/2018 270.0575           9.5%              7.7% (to 9/25/2018)
 .
.
.
.
.
.
.
.
.
.
.
.